Friday, April 19, 2024

Loading...
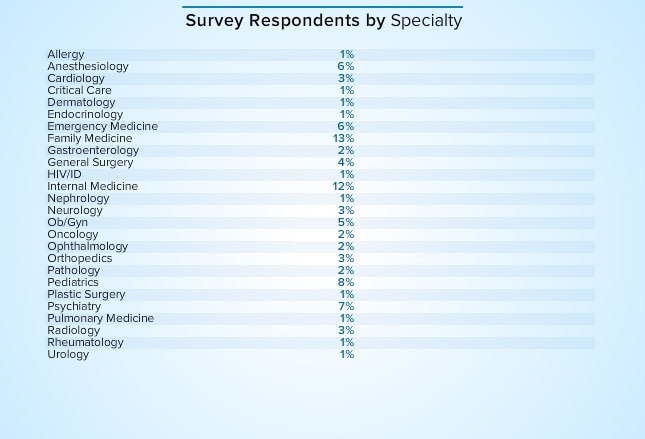
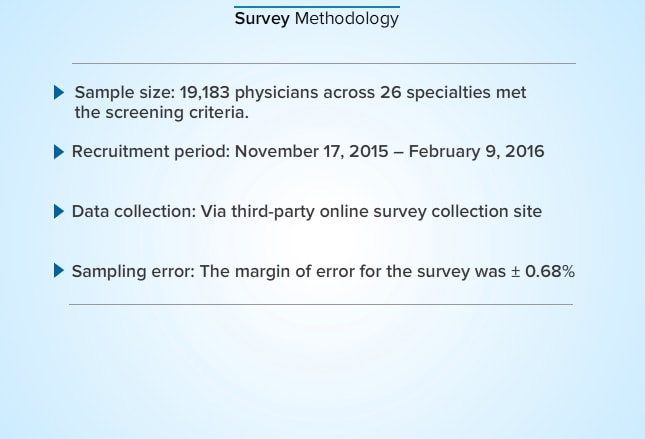
Nearly 19,200 physicians in over 26 specialties responded to this year's Medscape compensation survey and disclosed not only their compensation but also how many hours they work per week, how many minutes they spend with each patient, the most rewarding part of their job, changes to their practice resulting from healthcare reform, and more. (Note: Values in charts have been rounded and may not match the sums described in the captions.)
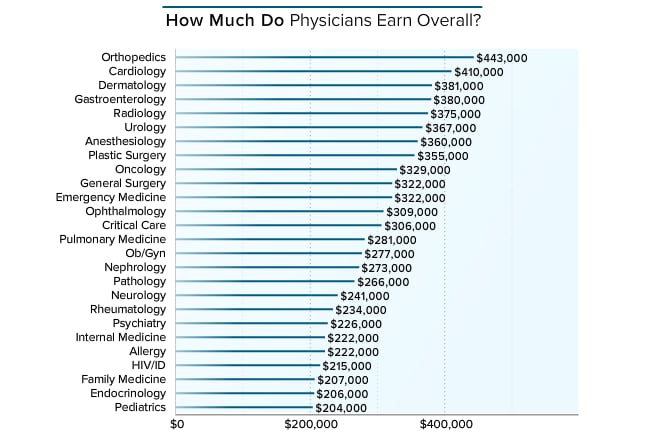
Physicians were asked to provide their annual compensation for patient care. For employed physicians, patient-care compensation includes salary, bonus, and profit-sharing contributions. For partners, this includes earnings after taxes and deductible business expenses but before income tax. The top three earners this year are orthopedists ($443,000), cardiologists ($410,000), and dermatologists ($381,000). Orthopedists and cardiologists were numbers one and two last year as well at $421,000 and $376,000, respectively. Within these specialties there is likely to be a wide range of earnings, as both orthopedics and cardiology include surgical subspecialists, who tend to make significantly more than their generalist counterparts.[1] This year the lowest earners, starting from last place, are pediatricians ($204,000), endocrinologists ($206,000), and family physicians ($207,000). Those specialties were in the bottom three last year as well.
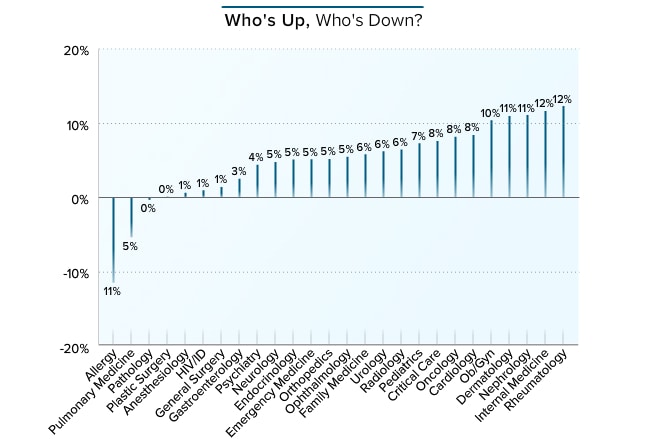
When comparing compensation with the prior year's figure, two specialties, allergy and pulmonology, experienced a noticeable decrease in income (-11% and -5%, respectively). Pathologists and plastic surgeons remained stable. The rest of the physicians reported an increase. The greatest increases appeared among rheumatologists and internists (12%), followed by nephrologists and dermatologists (11%). This year, several specialties were in the double digits and most were above 4%. When asked about the high increase in internist salaries, Travis Singleton, senior vice president of national physician search firm Merritt Hawkins, commented that the migration to hospital medicine has shrunk the candidate pool while, at the same time, "over 10,000 baby boomers turn 65 every day, driving demand for internists, and their compensation, higher."
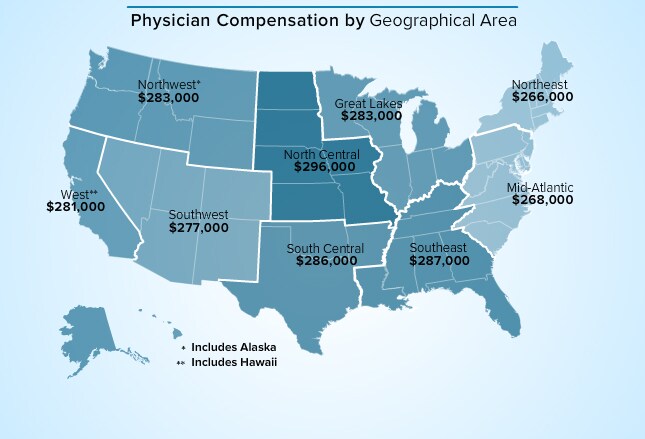
This year, the highest earnings were reported in the North Central ($296,000) and Southeast ($287,000) regions, while the lowest were in the Northeast ($266,000) and Mid-Atlantic ($268,000). Geographic supply and demand continue to play a role in compensation. Uneven distribution of physicians to patient volume, particularly in primary care, has been a problem for decades in rural and poor communities.[2] Numerous government policies are aimed at improving access to physicians in these areas. As a result, higher incomes are found in these regions.[3] Nevertheless, according to Travis Singleton of Merritt Hawkins, "While government programs certainly influence compensation, it is largely socioeconomics and competition that drive compensation on a macro scale. We are seeing the compensation gap between rural and urban areas diminish. Where it was once routine to see salaries 10%-15% higher 2-3 hours outside of the metropolitan market, now you see urban markets with large delivery systems raise salaries to level the playing field. In turn, that has caused smaller, more rural markets to add more compensation via salary, signing bonuses, and loan forgiveness."
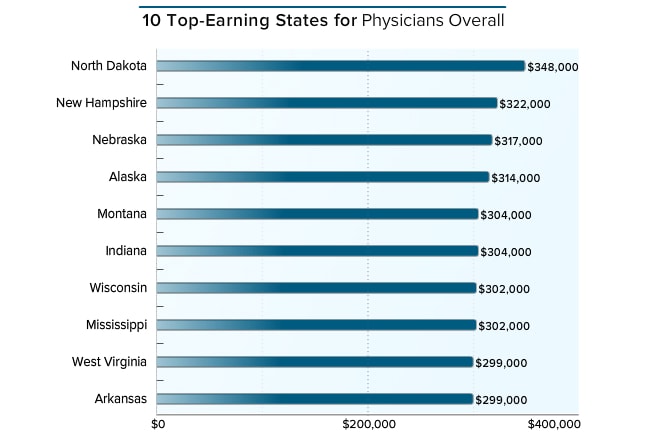
The weather may be less than inviting, but the pay may make up for it. In line with government efforts to attract more physicians to rural and poor areas, the three top-earning states in this year's Medscape report are North Dakota ($348,000), New Hampshire ($322,000), and Nebraska ($317,000). This also held last year, with the top earners located in North Dakota and Alaska (both at $330,000) followed by Wyoming ($312,000). Travis Singleton of Merritt Hawkins observed, "The oil boom in North Dakota has been driving demand and comp for physicians in North Dakota through the roof, but with current oil prices, that trend can be expected to cool considerably."
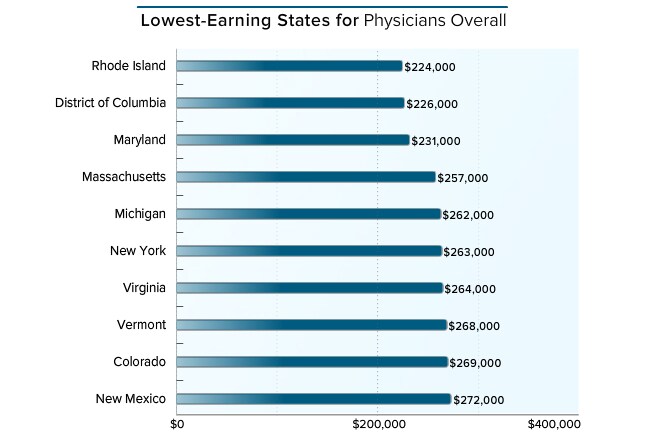
The three states/areas this year with the dubious distinction of lowest-earning are the same as last year: Rhode Island ($224,000), District of Columbia ($226,000), and Maryland ($231,000), all on the East Coast. In last year's Compensation Report, physicians fared worst in the District of Columbia ($186,000) and Rhode Island ($217,000). As well as having low-ranking compensation, Maryland was the only state out of the three that showed a decline in income this year (from $237,000).
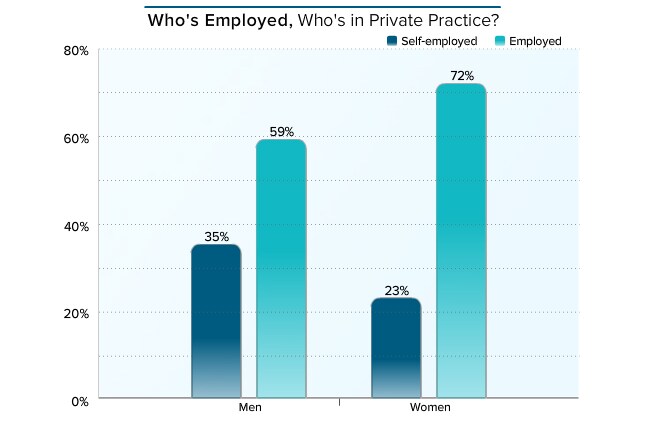
In this year's Medscape report, as in last, more women than men were employed (72% and 59%, respectively). Thirty-five percent of men and 23% of women were self-employed. The percentages were virtually identical to those reported last year. Younger physicians in particular are heading toward employment rather than private practice. Reasons include reluctance to deal with the business side of medicine and the desire for a predictable work schedule.[4] According to an American Medical Association report, the rate of practice ownership decreased from 61% in 2007-2008 to 53% in 2012. Ownership was highest among surgical subspecialties and lowest in pediatrics, emergency medicine, and family medicine.[5]
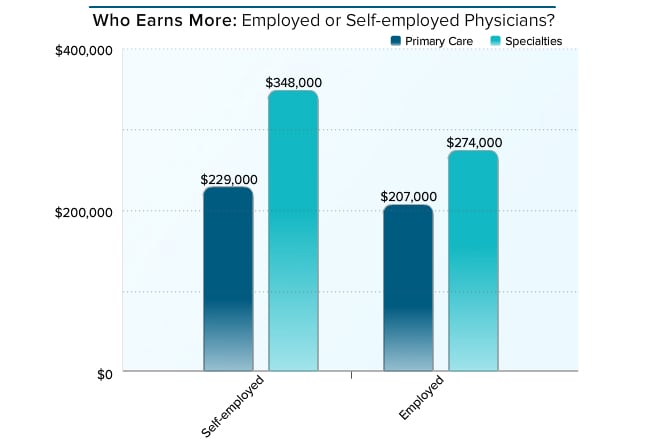
Employed physicians say they're glad they don't have the business responsibilities of self-employed physicians, but one potential negative to employment is lower average income. Primary care physicians (PCPs) make $207,000, only slightly less than their self-employed peers ($229,000). Self-employed specialists earn significantly more than employed specialists, and both groups earn more than PCPs. Compared with last year's Medscape Physician Compensation Report, however, employed PCPs experienced the highest percentage compensation increase (10%) compared with self-employed PCPs (8%) and all specialists (6%).
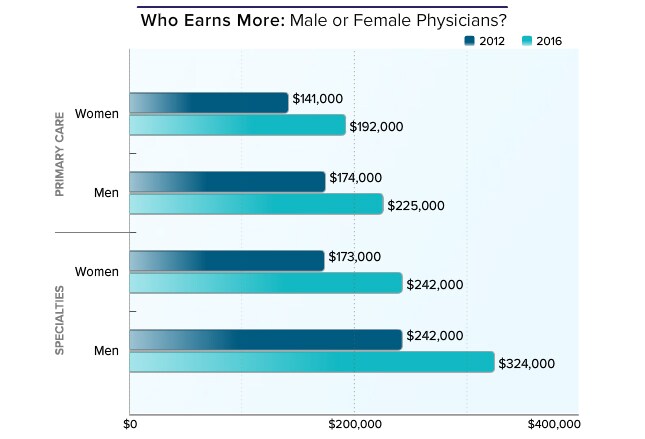
In our 2016 report, men still earn more than women, whether they are PCPs ($225,000 vs $192,000, respectively) or specialists ($324,000 vs $242,000, respectively). In 2012, male specialists made $242,000 vs $173,000 for women. Male PCPs made $174,000 and their female peers made $141,000. On an encouraging note, women's earnings increased more between the 2012 and 2016 reports than did men's: 36% for female PCPs and 29% for their male peers. For specialists, the percentage increases between those years are 40% for women and 34% for men.
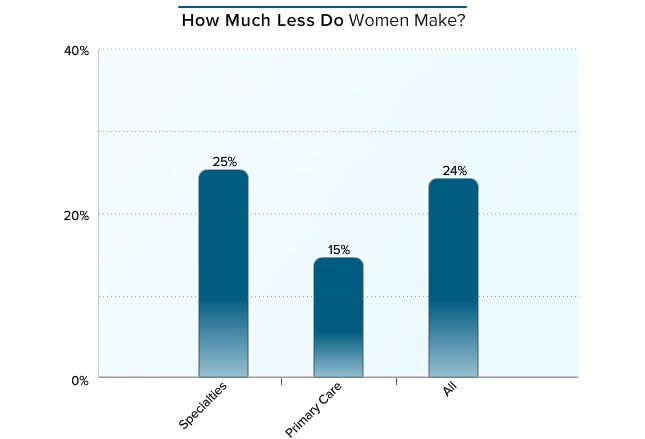
Overall, female physicians make 24% less than their male peers, although there is less of a disparity among PCPs (15%) than specialists (25%). When asked about this, Travis Singleton of Merritt Hawkins said, "The persistence of these disparities is puzzling because we see no contractual bias from our clients against female candidates." He observed that disparities may exist in work schedules, "particularly with younger female physicians who are in their peak child-rearing years and require flexible schedules, including part-time." It should be noted, however, that the compensation reported here is based on full-time positions.
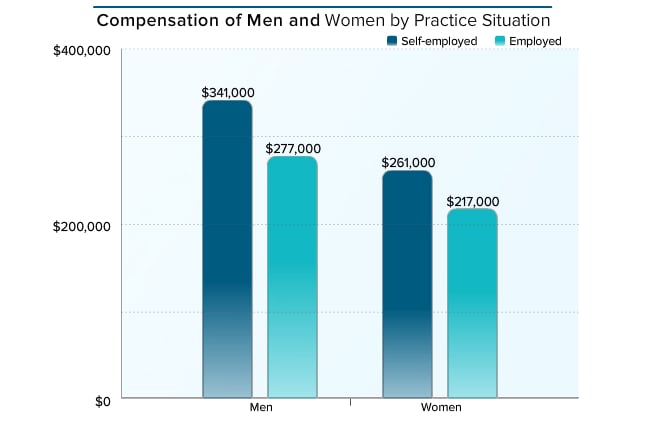
According to government data, the percentage of male physicians (65%) still considerably outnumbers that of females (35%), although women are catching up and are even surpassing men at younger ages.[6,7] This year, as in all previous Medscape Physician Compensation Reports, both self-employed and employed male physicians earn more ($341,000 and $277,000, respectively) than their female counterparts ($261,000 and $217,000, respectively). The percentage differences in earnings between men and women do not vary much between self-employed (31%) and employed (28%) physicians. However, when looking at employed PCPs, where the playing field is more level, men still earn 15% more than women.
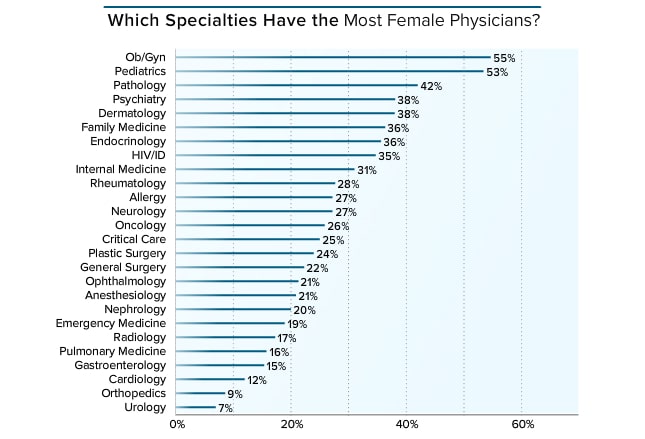
Overall, 31% of physicians are women. The highest percentages of women are found in ob/gyn (55%) and pediatrics (53%), followed by pathology (42%), psychiatry (38%), and dermatology (38%). About a third of PCPs are women: 36% of family physicians and 31% of internists. Women still tend to join nonsurgical specialties, with the fewest women choosing urology (7%), orthopedics (9%), and cardiology (12%).
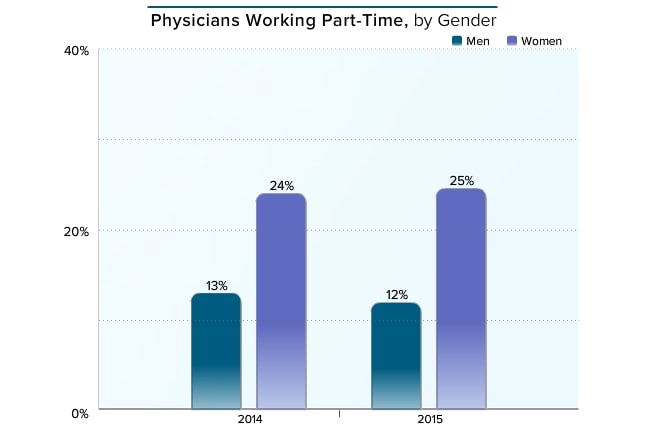
In this year's report, 12% of men and 25% of women say they work part-time, which has not changed since last year's report. Of interest, given the current physician shortage, is the growing proportion of women entering the profession who are also working part-time. Part-time is defined as working less than 40 hours per week.
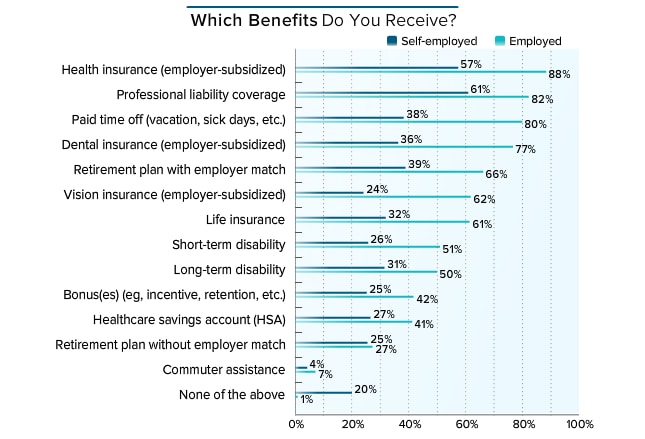
For physicians, benefits packages are richer among the employed vs the self-employed. Eighty-eight percent and 82% of employed physicians have paid or partially paid health insurance and liability coverage, respectively, compared with only 57% and 61% of the self-employed. And while 80% of employed physicians get paid time off, only 38% of those who are self-employed do. Of note, benefits for self-employed physicians are far fewer than for registered nurses, as seen in a 2015 Medscape report, in which 93% of nurses had paid time off and 88% had health insurance.
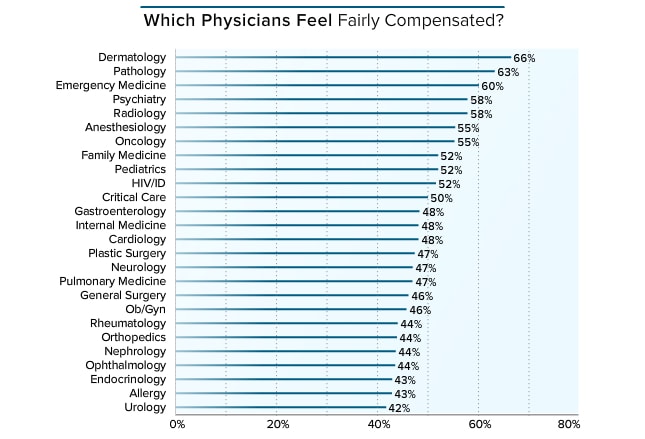
Slightly over half of all physicians (52%) believe that their compensation is fair. As in every year since 2012, dermatologists (66%) felt most fairly paid, and they are also the third highest earners this year. Pathologists (63%) and emergency medicine physicians (60%) followed in satisfaction, even though their earnings were toward the middle range among physicians. The least satisfied with compensation are urologists (42%), followed by allergists and endocrinologists (both 43%).
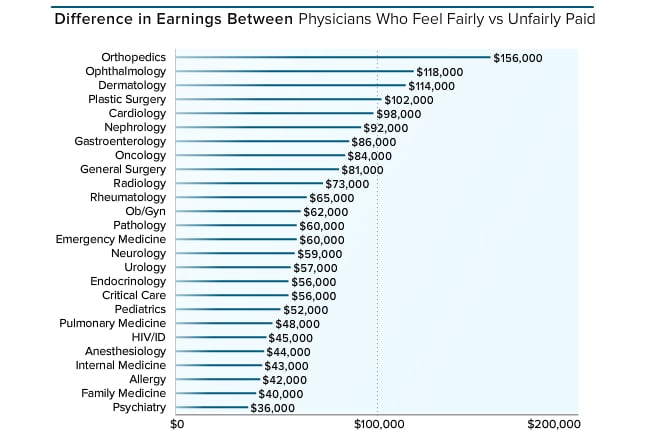
The report this year looked at the difference in earnings between physicians who thought their compensation was fair and their peers who thought it wasn't fair. Hardly a surprise, those who made more were more likely to feel fairly paid. Orthopedists, for example, are the highest-paid group, and those who think they are fairly paid make $156,000 more than those who believe that their compensation is unjust. Ophthalmologists and dermatologists who believe that they are compensated fairly make $118,000 and $114,000 more than their less content counterparts. When looking at gender, over half of women (51%), who make less overall than men, felt unfairly paid compared with 46% of men.
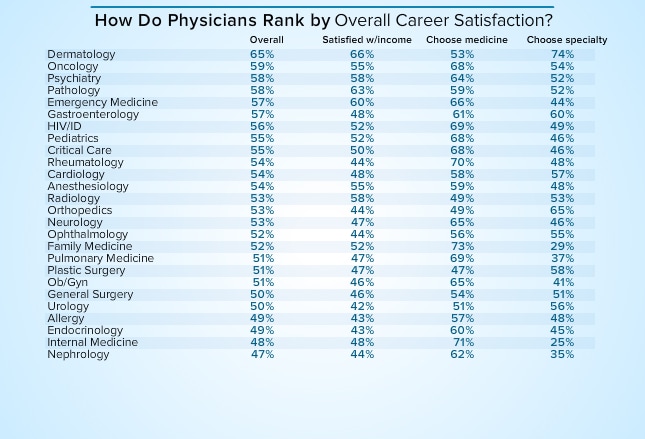
To determine the level of general career satisfaction, Medscape averaged the percentage of physicians who again would choose medicine as a career, those who again would choose their specialty, and those who thought they were fairly compensated. This year, dermatologists, at 65%, were the most satisfied, followed by oncologists (59%) and psychiatrists (58%). Dermatologists have consistently led in career satisfaction over the past five annual compensation reports. Gary Goldenberg, MD, assistant clinical professor of dermatology at Icahn School of Medicine at Mount Sinai in New York, offered a reason for this. "I believe it's because our patients tend to do well with treatment. We are also on the forefront of early detection and skin cancer prevention." At the bottom were nephrologists (47%), internists (48%), endocrinologists (49%), and allergists (49%). Their satisfaction rankings using these criteria appeared to have little to do with their earnings rank. Dermatologists are third in earnings, but oncologists and psychiatrists fall somewhere in the middle of the pack. And among the three groups least unsatisfied, only endocrinologists were among the lowest three in earnings.
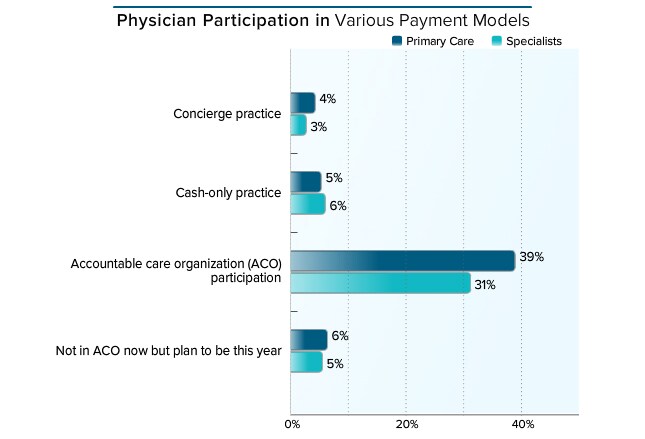
Specialists and PCPs have similar rates of cash-only practices (6% and 5%, respectively) as well as participation in a concierge model (3% and 4%). Thirty-seven percent of specialists participate or plan to participate this year in accountable care organizations (ACOs), which is much lower than PCP participation (45%). More PCPs (39%) also reported being in ACOs this year than in last year's report (35%). According to some experts, as of late 2015, questions remain about whether meeting quality metrics translates into meaningful improvement.[8]
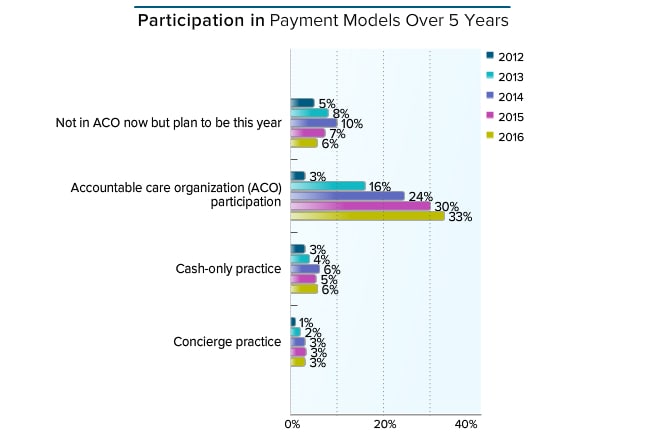
Despite considerable attention, cash-only and concierge practices are still not significant payment models.[9] In fact, as found in Medscape's Physician Compensation Reports, concierge practice has stayed at around 3% for the past 3 years. Cash practices saw a slight increase this year (6% vs 5% last year). Travis Singleton of Merritt Hawkins observed that in order to avoid the pressure of private practice, the "escape hatch" for many physicians has been employment rather than changing to concierge medicine. However, he has seen a continual increase in the "direct pay" model and urgent care delivery. Current and future participation in ACOs is still increasing, at 39% this year compared with 37% in last year's report.
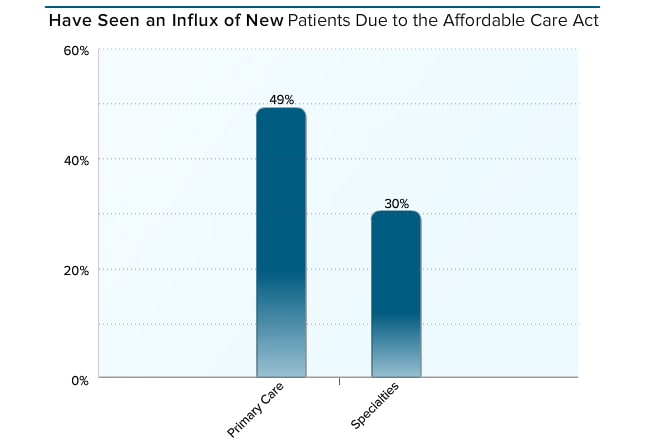
Nearly half of PCPs (49%) and 30% of specialists report having more patients because of the Affordable Care Act (ACA). A 2015 report analyzed how physicians viewed their ability to provide high-quality care a year after the implementation of the ACA.[10] It found no association with lower- or higher-quality care whether or not patient load had increased. Among those who said that quality had worsened, 21% had a higher patient load and 18% saw no increase. Over three quarters (78%) of physicians whose number of patients increased said that quality had stayed the same or improved, and 82% who experienced no increase reported the same experience.
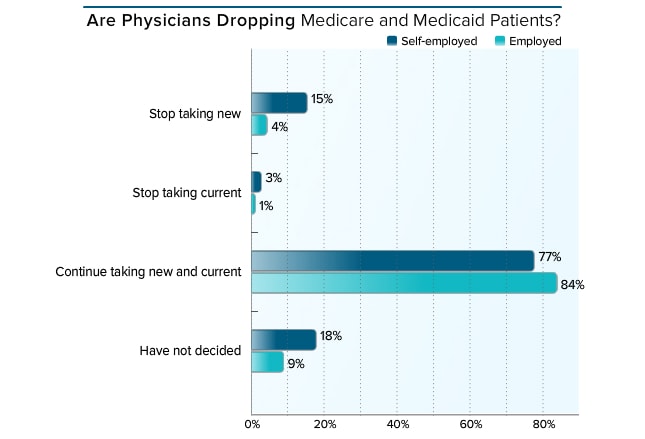
This year, 84% of employed and 77% of self-employed physicians say they are continuing to take new and current Medicare and Medicaid patients. In both groups, these percentages are considerably higher than in the 2015 report (79% and 64%, respectively). This year, 18% of self-employed and only 5% of employed physicians have stopped seeing their Medicare and Medicaid patients, which has not changed much from last year (16% and 6%, respectively).
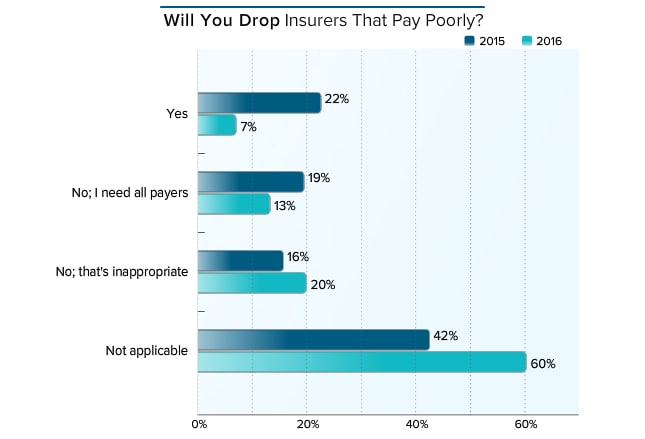
When asked whether they would discontinue insurers that pay poorly, this year only 7% of physicians (vs 22% last year) said they would. About a third in both years (33% in 2016 and 35% in 2015) would not drop payers. Note that in 2016, 60% of physicians vs 42% in 2015 chose "not applicable," probably an indication of the growing number of employed physicians, who do not make the decision regarding insurers.
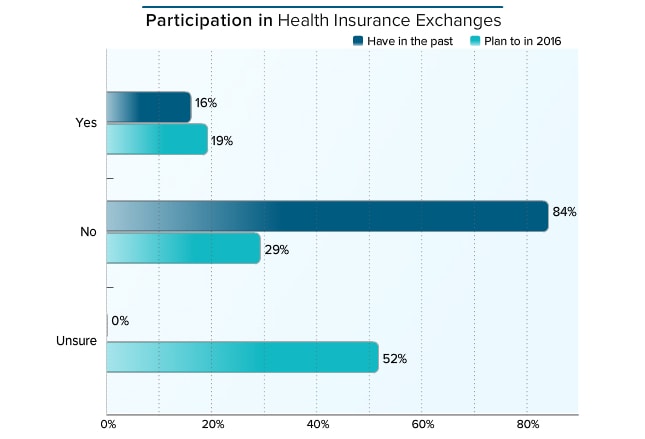
As of February 2016, 12.7 million Americans selected plans through the Health Insurance Marketplace, about 4% of the US population.[11] Current data are limited on the number of physicians who are participating. Often they have no choice, and many may be locked out of networks.[12] According to the 2015 and 2016 Medscape Physician Compensation Reports, last year 16% of physicians said they were participating in the exchanges and 84% were not. This year, 19% said they were participating, 29% were not, and slightly over half (52%) were uncertain.
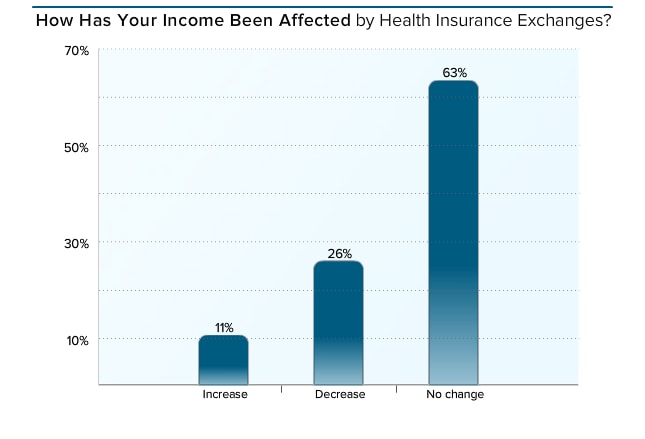
It is still not clear yet how the ACA affects physician income. Many variables will have a role in the ultimate results.[13] One study from the Robert Wood Johnson Foundation reported a 3% increase in reimbursement in states that expanded Medicaid eligibility and 3.3% in nonexpansion states.[14] When physicians who participated in health insurance exchanges last year were asked whether their income was affected, 63% reported no change and 11% said it had increased. About a quarter (26%) experienced a decrease.
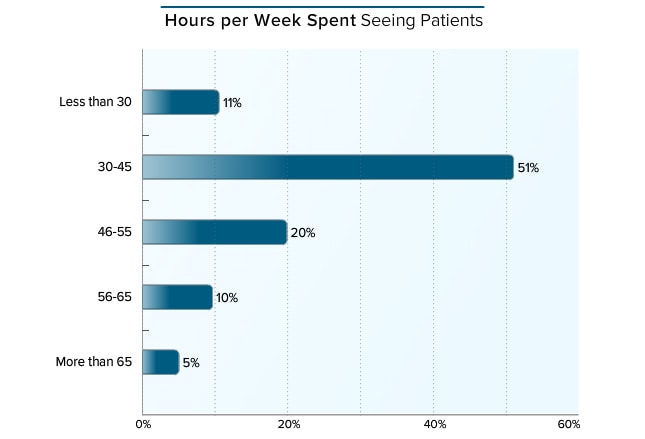
The number of hours spent seeing patients has not changed much since last year, when 10% of physicians spent fewer than 30 hours per week with patients compared with 11% in this year's report. Last year, 57% spent between 30 and 45 hours per week while 51% spent the same amount of time this year. This year, slightly more physicians spent 46 hours or more with patients (34% this year and 31% last year). According to a government analysis, middle-aged physicians work harder than both their younger and older peers. In fact, those between ages 46 and 55 work more hours now than they did in previous years, while younger doctors (36-45) work fewer hours than previously, perhaps because of the increase in women in those age groups, many of whom are working part-time.[7]
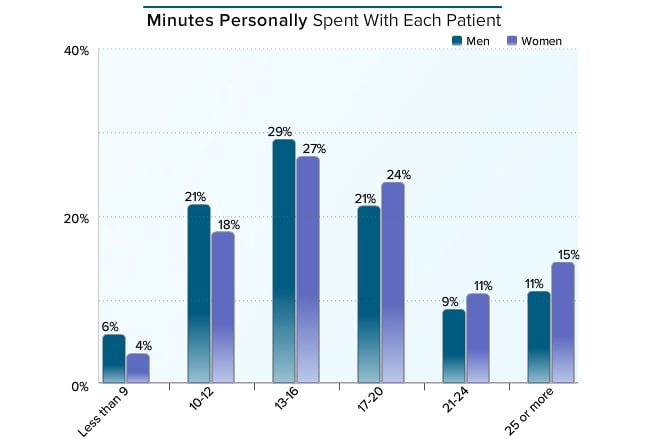
The amount of physician facetime with a patient is often an issue, and lately both physicians and patients complain about getting even less time. However, results of our 2016 survey were consistent with those of all surveys since 2011: 13-16 minutes is the most common amount of time spent with patients, followed by 17-20 minutes. Previous research found that female physicians spend more time with patients.[15] Indeed, in the 2012 Medscape Physician Compensation Report, 55% of female physicians spent 17 or more minutes with their patients compared with 48% of men. This, of course, is influenced by some of the specialties more commonly chosen by women; there are very few female physicians in critical and emergency care, which have shorter physician visits. In this year's report, however, the difference diminished, with 41% of men and 49% of women spending 17 or more minutes. There were only slight differences in the other time categories.
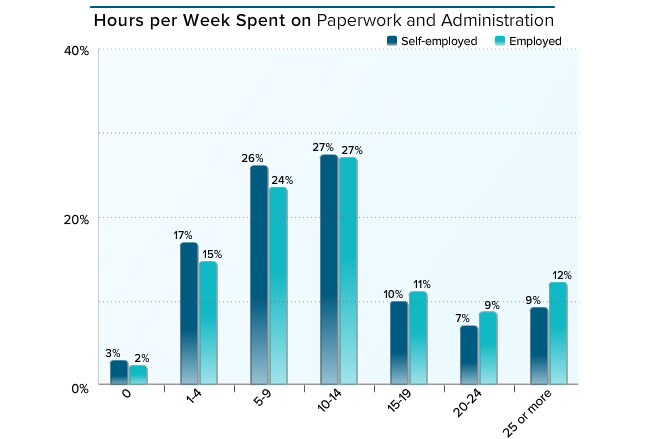
Bureaucratic tasks were the prime cause of burnout, according to this year's Medscape Lifestyle Report (and in previous ones as well). Second was spending too many hours at work. Medscape's Compensation Reports suggest that the paperwork problem is only getting worse. In the 2014 report, 35% of employed and 26% of self-employed physicians spent at least 10 hours per week on paperwork. This year, over half of physicians spent this amount of time (54% of self-employed physicians and 59% of employed).
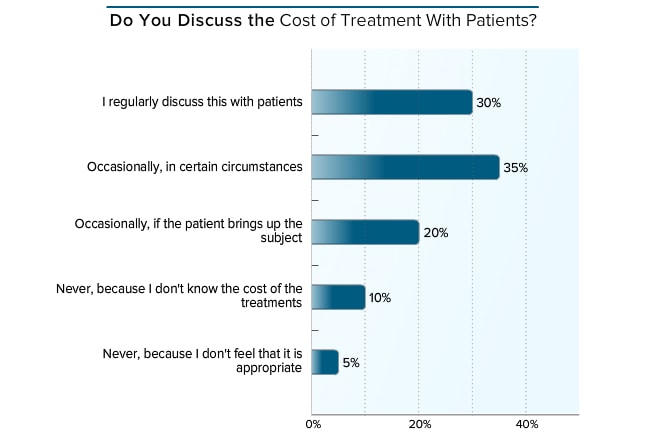
The authors of a 2013 editorial in the New England Journal of Medicine wrote, "Because treatments can be 'financially toxic,' physicians need to disclose the financial consequences of treatment alternatives just as they inform patients about treatments' side effects."[16] This year, 85% of physicians for whom this issue was applicable say they regularly or occasionally discuss the cost of treatment with patients, which is about the same (84%) as in the 2012 compensation survey.
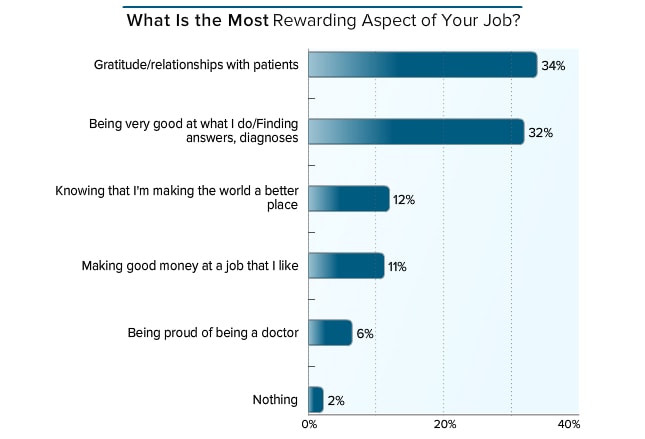
Despite complaints over red tape, work requirements, and changes in the healthcare field, a full 98% of respondents found gratification in being a physician and treating patients. This year, about a third of physicians cited their relationships with patients (34%) and being good at their job (32%) as the two most rewarding aspects of their job, the same as reported 3 years ago (31% and 34%, respectively). Most who commented on this question simply mentioned caring for or helping people. Other frequently mentioned rewards included doing research, educating or training students or residents, having a flexible schedule, and relationships with colleagues. Many physicians wrote "all of the above."
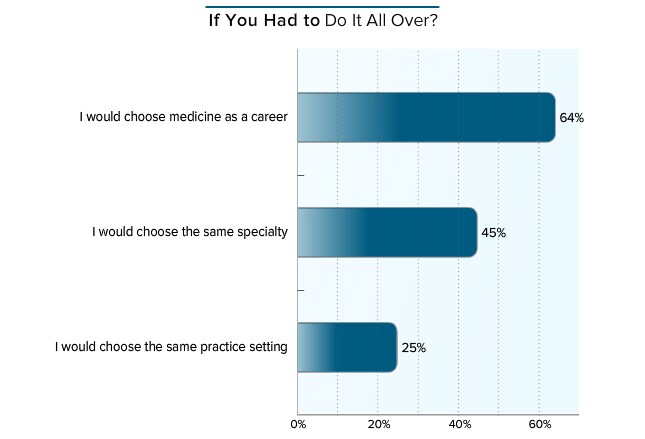
While the rewards of medicine still exist for the majority of respondents, the trend toward choosing to be a doctor again is steadily declining. The Medscape Physician Compensation Report survey has included this question for the past 5 years, and enthusiasm has waned in all three areas. In the 2011 report, 69% of physicians said they would choose medicine again and 61% would select their own specialty. This year, 64% would still choose medicine, but only 45% would select their own specialty. Furthermore, in 2011, half said they would choose their own current practice setting, but this year only 25% would go that same route.
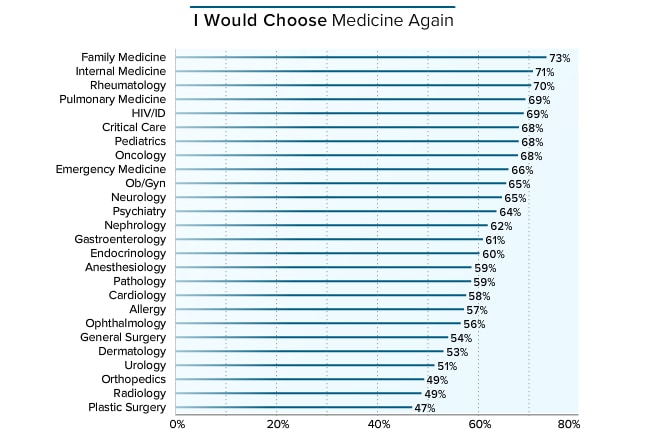
Money does not equal happiness. This year, 73% of family physicians and 71% of internists were at the top of the list of physicians most likely to choose medicine again, which is exactly the same as last year, when they were first and third, respectively. Of note, these primary care physicians were within the bottom 10 in earnings. Those least likely to choose medicine again are plastic surgeons (47%) and radiologists and orthopedists (both 49%). All three of these specialties were within the top 10 in earnings. It seems that physicians' earnings do not reflect the appeal of their profession.
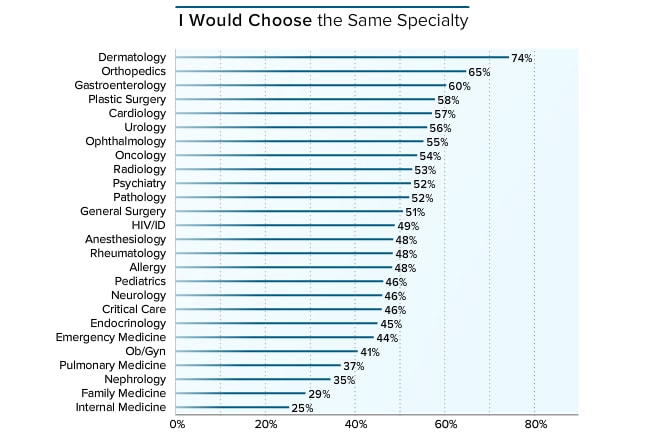
Although only 53% of dermatologists said they would choose medicine again, if they did, about three quarters (74%) of those would choose their own specialty. In second place, about two thirds (65%) of orthopedists would choose their own specialty, although only about half of them would want to be physicians again. And at the bottom of the list, only 25% of internists and 29% of family physicians would want to be primary care doctors again, but both groups were in the top two of re-choosing medicine as a career.